Show Results in the Geocortex Viewer for HTML5
The Show Results activity takes any feature, collection of features, or feature set that exists in the workflow, converts it to a feature set if necessary, adds the feature set to a collection, and displays the features. If the collection already exists, you can combine the feature set with an existing feature set, provided the features are from the same layer.
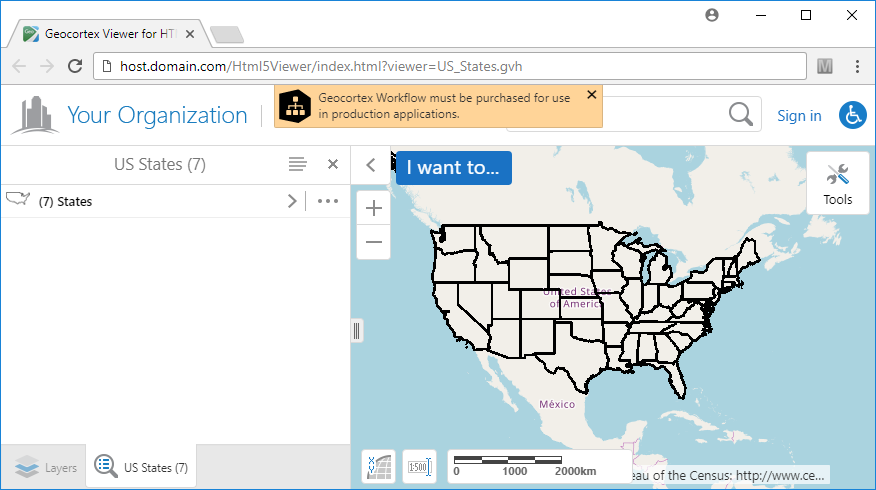
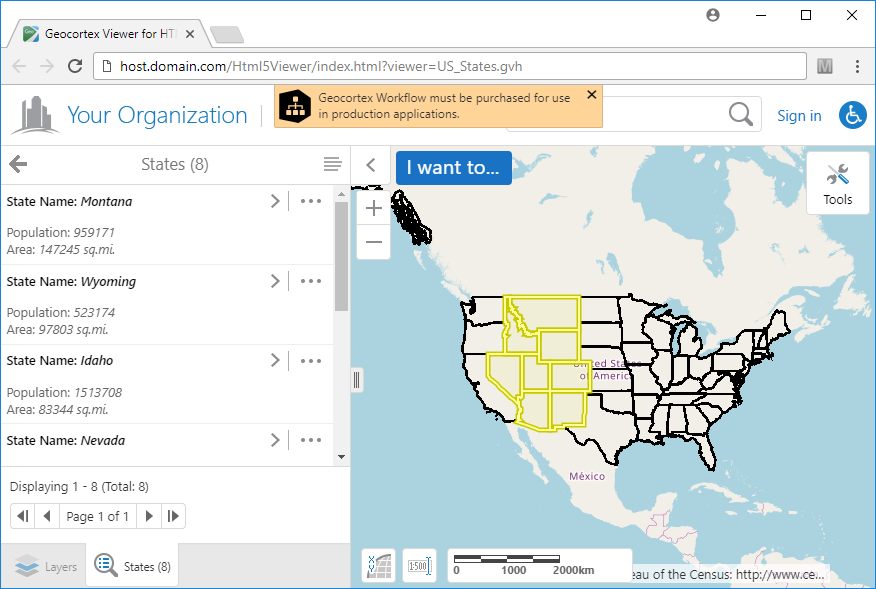
The Geocortex Viewer for HTML5 displays results in a list in the side panel by default ( ). The geometries are highlighted on the map (
 ). In the screen capture, the state of Montana is highlighted a different color because the user is hovering the pointer over Montana in the Results list (
 ).
).
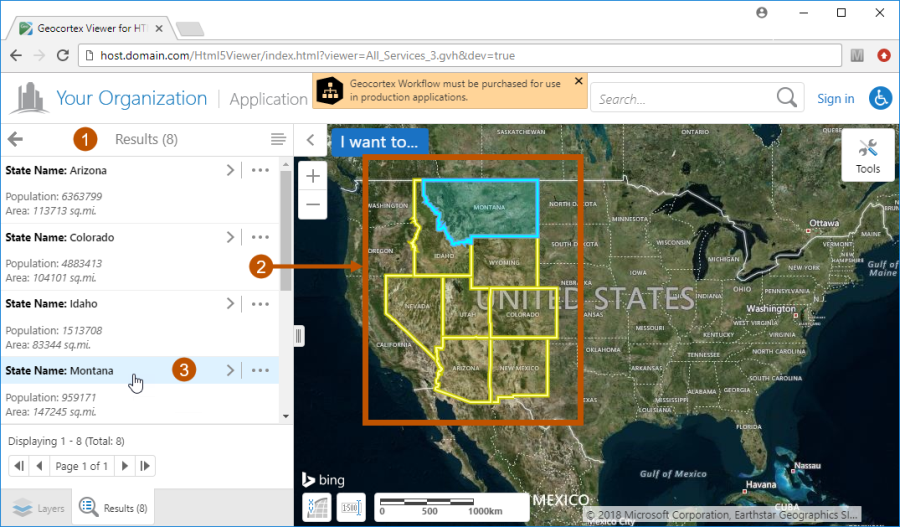
Features displayed using the Show Results activity, shown in the Geocortex Viewer for HTML5
The Geocortex Viewer for HTML5 offers many additional functions for working with results:
|
View Feature Details - Clicking a particular feature in the Results list zooms the map to that feature and displays details about the feature, including the feature's attributes. To return to the Results list, the user clicks the close icon |
|
|
|
Panel Actions Menu - The Panel Actions menu offers functions that operate on the features in the Results list, such as exporting or saving the features. The Panel Actions menu also has an option to switch between list view and table view. |
|
|
Feature Actions Menu - The Feature Actions menu offers functions that operate on a particular feature in the Results list, such as buffering the feature or removing the feature from the list. |
|
|
Collection Panel - The Geocortex Viewer for HTML5 supports multiple feature sets in a collection. Clicking the icon to go to the previous panel shows the feature sets in the collection. The Results Actions menu ( |
The Show Results activity fulfills the same purpose in VertiGIS Studio Workflow as the Select Features activity fulfills in Geocortex Essentials Workflow.
Configure the Show Results Activity to Run in the Geocortex Viewer for HTML5
To configure a Show Results activity, you must configure the Features input, which specifies the features to show. You will configure additional inputs. The particular inputs you configure depend on your scenario. The main factors that determine which inputs to configure are:
-
Whether the Show Results activity has access to configuration information for the layer that the features belong to
See Example 1 - Format Features Using the Show Results Activity’s Inputs and
Example 2 - Format Features Using the Layer’s Existing Configuration.
-
Whether you are going to combine the feature set with an existing feature set
Inputs Supported by the Geocortex Viewer for HTML5
The Geocortex Viewer for HTML5 supports all of the Show Results activity's inputs:
-
Features: (required) The features to display. You can specify a feature set, a collection of features, or a single feature. If you specify a collection of features or a single feature, the Show Results activity converts it to a feature set.
-
Map Service Id, Layer Id, Layer Name: If the layer exists in the map, configuring Map Service Id and Layer Id or Layer Name gives the Show Results activity access to the layer's configuration. This allows the activity to do the following:
-
Use the layer to display the geometries.
-
Use the layer's Feature Label, Feature Long Description, Feature Description, and Layer Icon URI configuration to display the features. You can override the layer's configuration by configuring the Show Results activity's Label Format, Long Description Format, Description Format, and Icon URI inputs. For information on configuring the Feature Label, Feature Long Description, Feature Description, and Layer Icon URI settings, see Details Tab for Layers.
Layer Id is preferred over Layer Name. To find the layer's ID, edit the layer in Geocortex Essentials Manager. The ID is given on the layer's Details tab. To find the map service's ID, edit the map service. The ID is given on the map service's Details tab.
Because the map service and layer IDs are numeric and the Map Service Id and Layer Id inputs are strings, you must configure the inputs using an expression with the ID enclosed in quotes. For example, if the map service's ID is 1 and the layer's ID is 3, set Map Service Id to
="1"and set Layer Id to="3".See Example 2 - Format Features Using the Layer’s Existing Configuration.
-
-
Label Format, Description Format, Long Description Format, Icon URI: If the layer does not exist in the map, or you do not configure Map Service Id and Layer Id, the Show Results activity cannot access the layer's configuration. In this case:
-
The Show Results activity creates a graphics layer that it uses to display the geometries.
-
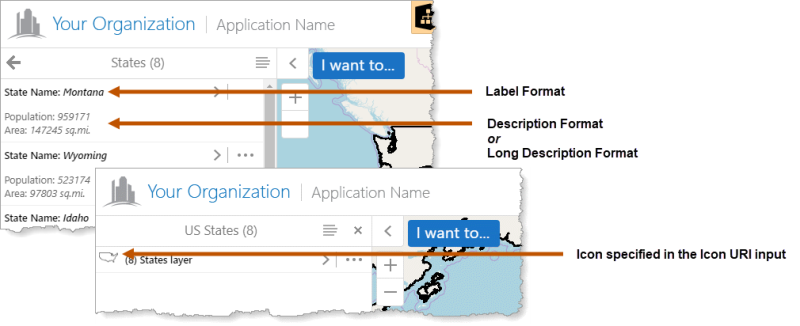
You can specify what information to display for each feature by configuring Label Format and Description Format or Long Description Format. If you configure Icon URI, the icon is displayed beside the feature set on the collection's panel.
Label Format defines a single line that functions as the heading for that feature. The lines that follow Label Format are defined in Description Format or Long Description Format, depending on which setting the viewer is configured to use, Feature Long Description or Feature Description. If the viewer is configured to use Feature Long Description (the default), the Show Results activity uses Long Description Format. If the viewer is configured to use Feature Description, the Show Results activity uses Description Format. You can configure the viewer to use Feature Description instead of Feature Long Description.
Show Results inputs that affect the Results list (back) and the collection's panel
You can use HTML markup and field tokens in the configuration for the Label Format, Long Description Format, and Description Format inputs. For example, in the screen capture, Label Format is configured as
State Name: <i>{STATE_NAME}</i>. Field tokens are replaced at run time by the value of the specified field. To specify a field token, surround the field name with curly brackets, for example, {STATE_NAME} is the field token for the STATE_NAME field.See Example 1 - Format Features Using the Show Results Activity’s Inputs.
-
-
Collection Name, Combine Mode, Show Notification, FeatureSet Id: You can combine the feature set with an existing feature set by configuring Collection Name, Combine Mode, and optionally Show Notification. If the Show Results activity does not have access to the layer's configuration, you must also configure FeatureSet Id.
For example, you could add two Show Results activities to your workflow. The first Show Results activity creates the collection and displays the feature set. The second Show Results activity combines its feature set with the existing feature set and displays the combined set of features. To configure the two Show Results activities, configure the following settings:
-
Collection Name: The name of the collection to add the feature set to. The two Show Results activities must use the same collection name. You can either use the same name in both activities or leave Collection Name blank in both activities.
The collection name appears at the top of the collection's panel, so use a meaningful name.
-
Combine Mode: The operation to use to combine the feature sets. Set Combine Mode in the second Show Results activity to the operation you want to use to combine its feature set with the existing feature set. If you leave Combine Mode blank, a union operation will be used.
-
FeatureSet Id: The ID of the feature set being operated on. If the Show Results activities do not have access to the layer's configuration, the activities must use the same non-blank FeatureSet ID. Configure the ID you want to use in both activities.
The FeatureSet Id appears beside the feature set in the collection's panel, so use a meaningful name.
-
Show Notification: If you want to display a message to the user when feature sets are combined, set Show Notification in the second Show Results activity to
true.
-
Example 1 - Format Features Using the Show Results Activity’s Inputs
This example shows you how to use a Show Results activity to display the features returned by a Query Layer activity when the Show Results activity does not have access to the layer's configuration. Because the Show Results activity does not have access to the layer, the geometries are displayed on a graphics layer created for that purpose.
This example assumes that you already have Geocortex Viewer for HTML5 to run the workflow. To demonstrate conclusively that the Show Results activity uses the formatting configured in the activity, rather than the formatting in the layer’s configuration, the layer should not exist in the site.
Workflow Logic
The workflow has the following activities, in the order shown:
-
Query Layer (
query1): Query an ArcGIS layer for US states in a particular region. -
Show Results: Display the feature data and geometries for the feature set returned by the query.
To format and show query results that are displayed by a Show Results activity:
-
Open Workflow Designer.
-
In a new, blank workflow, add the following activities and connect them in the given order:
- Query Layer (
query1) - Show Results
- Query Layer (
-
Query Layer (
query1): Configure the inputs:-
Url:
https://sampleserver6.arcgisonline.com/arcgis/rest/services/Census/MapServer/3This is the URL for a layer of US states.
-
Where:
SUB_REGION='Mountain' -
Return Geometry:
true -
Output Spatial Reference: Enter the spatial reference of the map. This ensures that the geometries are rendered accurately on the map.
-
Output Fields:
STATE_NAME, SQMI, POP2007
-
-
Show Results: Configure the inputs:
-
Set the Features input to:
=$query1.resultsThis specifies the features to display.
-
Set the Label Format input to:
State: <i>{STATE_NAME}</i>This specifies the heading text to display for each feature. When the features are displayed, {STATE_NAME} will be replaced by the value of the STATE_NAME field for this feature.
-
If your viewer is configured to use Feature Long Description in the Results list, configure the Long Description Format input. If your viewer is configured to use Feature Description, configure Description Format. Use the following value:
Population: <i>{POP2007}</i><br />Area: <i>{SQMI} sq.mi.</i>This specifies the information to display below the label.
-
-
Press Ctrl+S to save the workflow.
-
Configure your viewer to run the workflow.
See Host and Run Workflows in the Geocortex Viewer for HTML5 for information.
-
Launch or refresh the viewer and run the workflow.
The features listed in the Results list are formatted using the formatting configured in the Show Results activity.
Example 2 - Format Features Using the Layer’s Existing Configuration
In this example, the features come from a Query Layer activity that is configured the same as the Query Layer activity in Example 1. In this example, however, the layer that the features belong to exists in the map. The Show Results activity is configured to take advantage of the layer's configuration:
-
Map Service Id and Layer Id are configured, providing the Show Results activity with access to the layer's configuration.
-
Label Format, Description Format, Long Description Format, and Icon URI are left blank to ensure they don't override the layer's configuration.
Workflow Logic
The workflow has the following activities, in the order shown:
-
Query Layer (
query1): Query an ArcGIS layer for US states in a particular region. -
Show Results: Display the feature data and geometries for the feature set returned by the query.
If you want to try this example, configure the following site and viewer:
-
Create an empty site.
-
Add the Open Street Map basemap: Click Add Map Service, search for Open Street Map, and click Add to Map.
The map service's ID should be 0. The ID is given on the map service's Details tab.
-
Set the layer's Feature Label to:
State Name: <i>{STATE_NAME}</i> -
Set the layer's Feature Long Description to:
Population: <i>{POP2007}</i><br />Area: <i>{SQMI} sq.mi.</i> -
Add the following layer to the map:
https://sampleserver6.arcgisonline.com/arcgis/rest/services/Census/MapServer/3This is the URL for a layer of US states. The layer's ID is 3.
-
Add an HTML5 viewer.
To use the viewer's configuration to format query results that are displayed by a Show Results activity:
-
Open Workflow Designer.
-
In a new, blank workflow, add the following activities and connect them in the given order:
- Query Layer (
query1) - Show Results
- Query Layer (
-
Query Layer (
query1): Configure the inputs:-
Url:
https://sampleserver6.arcgisonline.com/arcgis/rest/services/Census/MapServer/3 -
Where:
SUB_REGION='Mountain' -
Return Geometry:
true -
Output Spatial Reference:
102100 -
Output Fields:
STATE_NAME, SQMI, POP2007
-
-
Show Results: Configure the inputs:
-
Set the Features input to:
=$query1.resultsThis specifies the features to display.
-
Set the Map Service Id input to:
0Alternatively, you can specify the Map Service ID as a string:
="0"Set the Layer Id input to:
3Alternatively, you can specify the Layer ID as a string:
="3"Together, these inputs provide the information that the Show Results activity needs in order to access the layer and its configuration.
-
Make sure the Label Format, Long Description Format, Description Format, and Icon URI are blank.
-
-
Press Ctrl+S to save the workflow.
-
Configure the viewer to run the workflow.
See Host and Run Workflows in the Geocortex Viewer for HTML5 for information.
-
Launch or refresh the viewer and run the workflow.
The features in the Results list are formatted using the formatting configured in the layer's configuration.
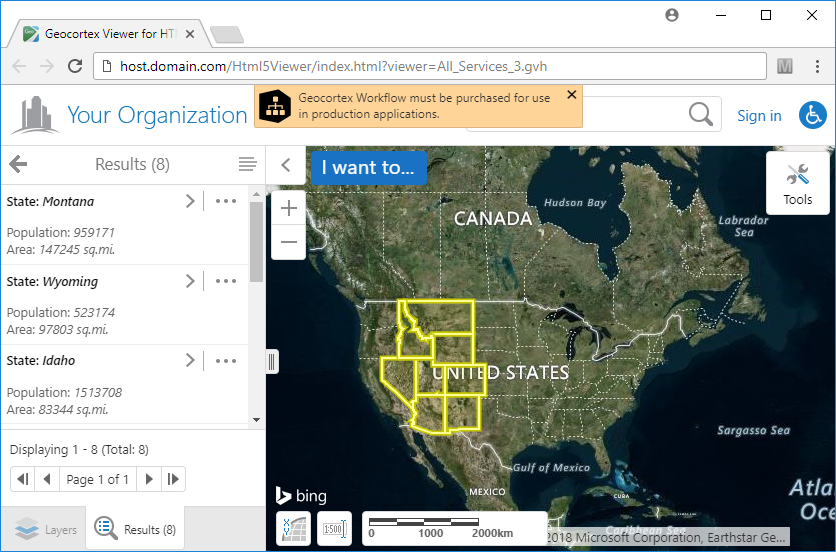
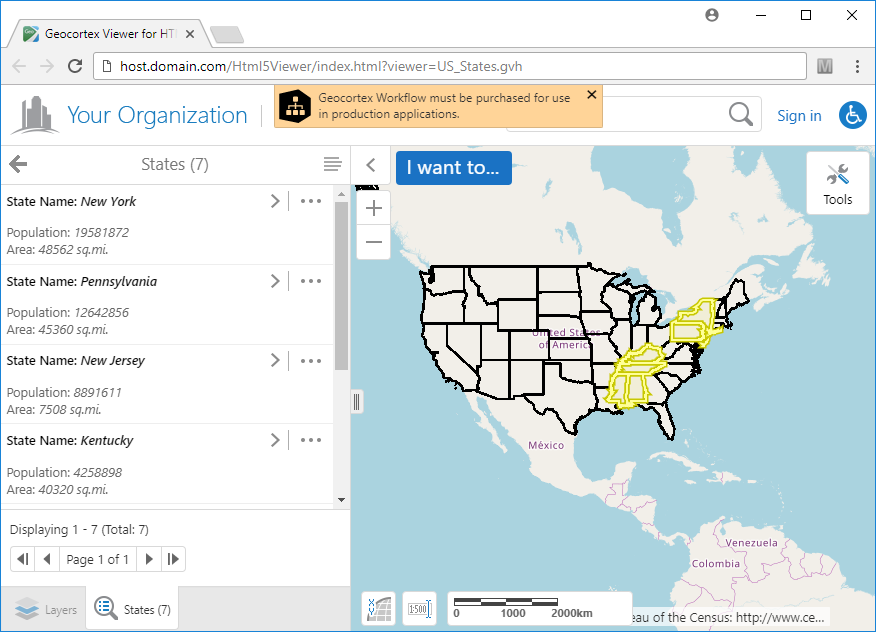
Example 3 - Combine Feature Sets
This example shows you how to use a Show Results activity to combine the feature set with an existing feature set from an earlier Show Results activity. The features belong to a layer of US states returned by two Query Layer activities. The first query returns the 3 states in the Middle Atlantic region. The second query returns the 4 states in the East South Central region. The second Show Results activity combines the two sets of states using a union operation, resulting in a feature set of 7 states, which are displayed using the layer's configuration.
Workflow Logic
The workflow has the following activities, in the order shown:
-
Query Layer (
query1): Query an ArcGIS layer for the 3 US states in the Middle Atlantic region. -
Show Results: Display the states returned by the query.
-
Delay: Pause the workflow for a few seconds so you can see the results of the first query.
-
Query Layer (
query2): Query the same ArcGIS layer for the 4 US states in the East South Central region. -
Show Results: Union the 4 states returned by
query2with the 3 states returned byquery1and display the 7 states.
If you want to try this example, follow the instructions in Example 2 to configure the site and viewer.
To combine feature sets using two Show Results activities:
-
Open Workflow Designer.
-
In a new, blank workflow, add the following activities and connect them in the given order:
- Query Layer (
query1) - Show Results
- Delay
- Query Layer (
query2) - Show Results
- Query Layer (
-
Query Layer (
query1): Configure the inputs:-
Url:
https://sampleserver6.arcgisonline.com/arcgis/rest/services/Census/MapServer/3 -
Where:
SUB_REGION='Middle Atlantic' -
Return Geometry:
true -
Output Spatial Reference:
102100 -
Output Fields:
STATE_NAME, SQMI, POP2007
-
-
Show Results: Configure the inputs:
-
Set the Features input to:
=$query1.resultsThis specifies the features to display.
-
Set the Map Service Id input to:
0Alternatively, you can specify the Map Service ID as a string:
="0"Set the Layer Id input to:
3Alternatively, you can specify the Layer ID as a string:
="3"Together, these inputs provide the information that the Show Results activity needs in order to access the layer and its configuration.
-
Set Collection Name to:
US StatesThe combine operation will be performed on this collection.
-
Make sure the Label Format, Long Description Format, Description Format, and Icon URI are blank.
This ensures that the Show Results activity uses the configuration from the layer instead of from the activity.
-
-
Delay: Set the Duration input to:
5000 -
Query Layer (
query2): Configure the inputs:-
Url:
https://sampleserver6.arcgisonline.com/arcgis/rest/services/Census/MapServer/3 -
Where:
SUB_REGION='East South Central' -
Return Geometry:
true -
Output Spatial Reference:
102100 -
Output Fields:
STATE_NAME, SQMI, POP2007
-
-
Show Results: Configure the inputs:
-
Set the Features input to:
=$query2.resultsThis specifies the features to display.
-
Set the Map Service Id input to:
0Alternatively, you can specify the Map Service ID as a string:
="0"Set the Layer Id input to:
3Alternatively, you can specify the Layer ID as a string:
="3"Together, these inputs provide the information that the Show Results activity needs in order to access the layer and its configuration.
-
Set Collection Name to:
US StatesIn order to combine the feature sets, the two Show Results activities must operate on the same collection.
-
Set Combine Mode to:
unionThis specifies the operation to use to combine the two feature sets.
-
Make sure the Label Format, Long Description Format, Description Format, and Icon URI are blank.
This ensures that the Show Results activity uses the configuration from the layer instead of from the activity.
-
-
Press Ctrl+S to save the workflow.
-
Configure your viewer to run the workflow.
See Host and Run Workflows in the Geocortex Viewer for HTML5 for information.
-
Launch or refresh the viewer and run the workflow.
The features from both queries are displayed.
-
Click the Go Back In Panel icon
 to go to the previous panel.
The US States collection contains a single feature set with 7 features.