Simulation
Geocortex Workflow Simulator
The Workflow Designer has a built-in simulator that enables you to run workflows in a simulated environment. The simulator makes it possible to test a workflow step-by-step and fix any issues before you deploy it.
Typically, you go back and forth between designing a workflow and simulating it. You use the simulator to test and refine your workflow as you go. In other words, run the simulator to test your workflow, return to the design interface to make modifications, run the simulator again, and so on, until you are satisfied that your workflow does what you expect it to.
The best way to learn about the simulator is by following a step-by-step example.
To start the simulator while you are designing a workflow in the Activity Builder, press F5. To return to the Activity Builder from the Simulator, press Shift +F5.
Open the Simulator
To open the simulator:
-
Click Start Simulator
 in Workflow Designer's ribbon.
Simulator Interface
This section describes Workflow Designer's simulator interface. For information about the Designer interface, see Design Interface.
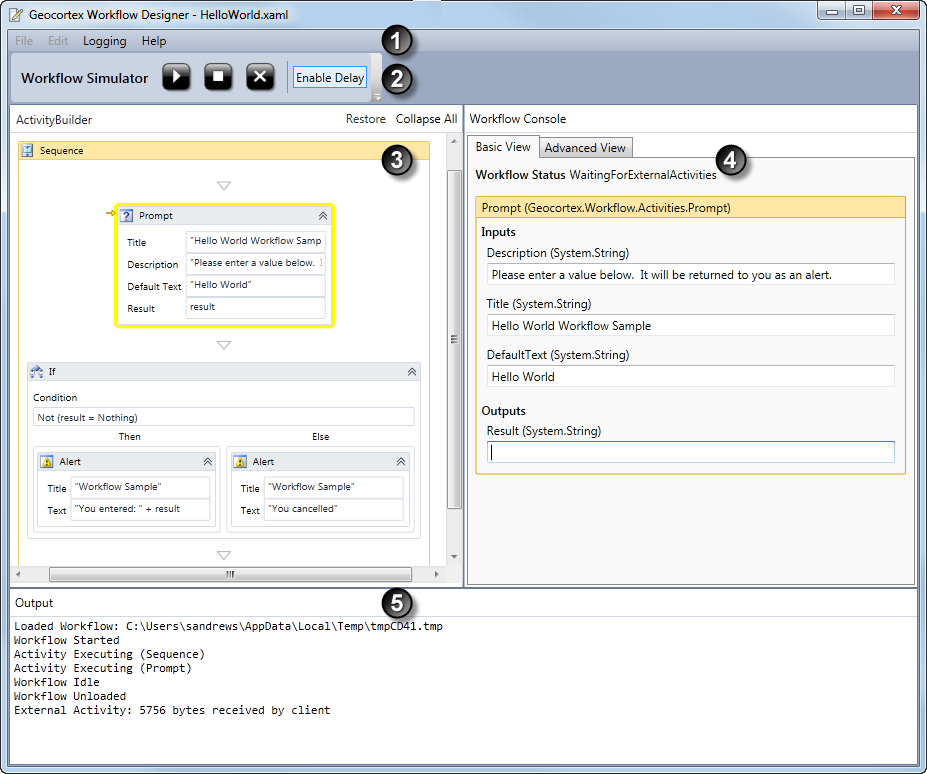
Simulator interface
The numbers in the screen shot correspond to the numbers in the table below.
|
# |
Component |
Description |
|---|---|---|
|
|
Menu bar |
In the simulator, you have access to the Help menu and Logging menu. Having access to the Logging menu means you can change the application log level while your workflow is executing, to help with debugging. |
|
|
Ribbon |
The ribbon has the following controls:
|
|
|
Workflow view |
The workflow image is the same image that appears in the design area, except that in the simulator it is read-only and shows a trace of the executing activities. This makes it easy to follow the execution path through the workflow. The activity that is currently executing is framed in yellow. |
|
|
Workflow Console |
The Workflow Console simulates the client. When the user or client application is prompted for input, you have to play the role of the client by entering the input into the Workflow Console. You click the Start icon to begin a workflow or resume a workflow that is paused and accepting client input. The Workflow Console also has an Advanced View tab that shows the JSON of communications from the server to the client. |
|
|
Output area |
The Output area provides a textual trace of the execution. Log and WriteLine activities output to the Output area. |


Start and Stop a Simulation
Click Start ![]() in the simulator's ribbon to launch the workflow or to resume running if the workflow is paused for user input.
in the simulator's ribbon to launch the workflow or to resume running if the workflow is paused for user input.
Click Stop ![]() to halt the workflow. You cannot resume running the workflow after you have stopped it—you must start it from the beginning again.
to halt the workflow. You cannot resume running the workflow after you have stopped it—you must start it from the beginning again.
You can stop your workflow when:
-
The workflow completes.
-
An error occurs.
-
You want to halt execution.
Exit the Simulator
To exit the simulator:
-
Click Exit
 in the simulator ribbon to return to the Workflow Designer.
Simulation Walkthrough
This section walks you through a simple workflow as it executes in the Simulator. The example workflow prompts the user for their name, and then echoes it back to the user. If the user clicks OK without entering their name, the workflow displays an error message.
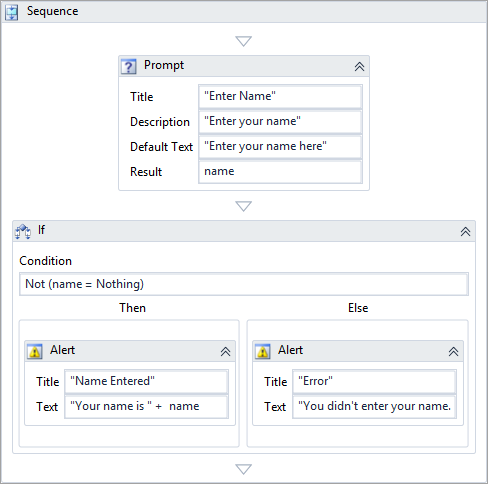
Example workflow used in the following simulation
To run a workflow in the Simulator:
-
In Workflow Designer, open the workflow that you want to run in the Simulator.
-
To load the workflow in the Simulator, click Start Simulator
in the ribbon.The workflow is read-only in the Simulator—you cannot edit it.
-
To start the workflow, click Start
 .
. Workflows start executing with the outermost activity. In this case, the outermost activity is a Sequence activity. The Output area, which shows the server-side operations, indicates that the workflow has started executing. The workflow pauses when it reaches an activity that requires user input, such as a Prompt activity. The screen capture shows the state of the workflow when the Prompt activity is waiting for user input:
-
In the ActivityBuilder area, a yellow border surrounds the activity that is currently executing and an arrow
 points to the activity's name.
 A workflow can execute so quickly that it is difficult to see what the current activity is, unless the workflow is paused for user input. To slow down the execution, click Enable Delay in the Simulator's toolbar.
-
The Output area indicates that the client has received some information from the server (
External Activity: 3427 bytes received by client). This is the information that the client requires to execute the Prompt activity. The server unloads the workflow while it waits for a response from the client. -
The Workflow Console shows the client-side operations. The Basic View tab shows the workflow's status as
WaitingForExternalActivities, indicating that the workflow has paused. Below the status, the Console shows a simulation of what the user sees, in this case, the Prompt activity's dialog box. The Advanced View tab shows the JSON that the server sent to the client for the Prompt activity.
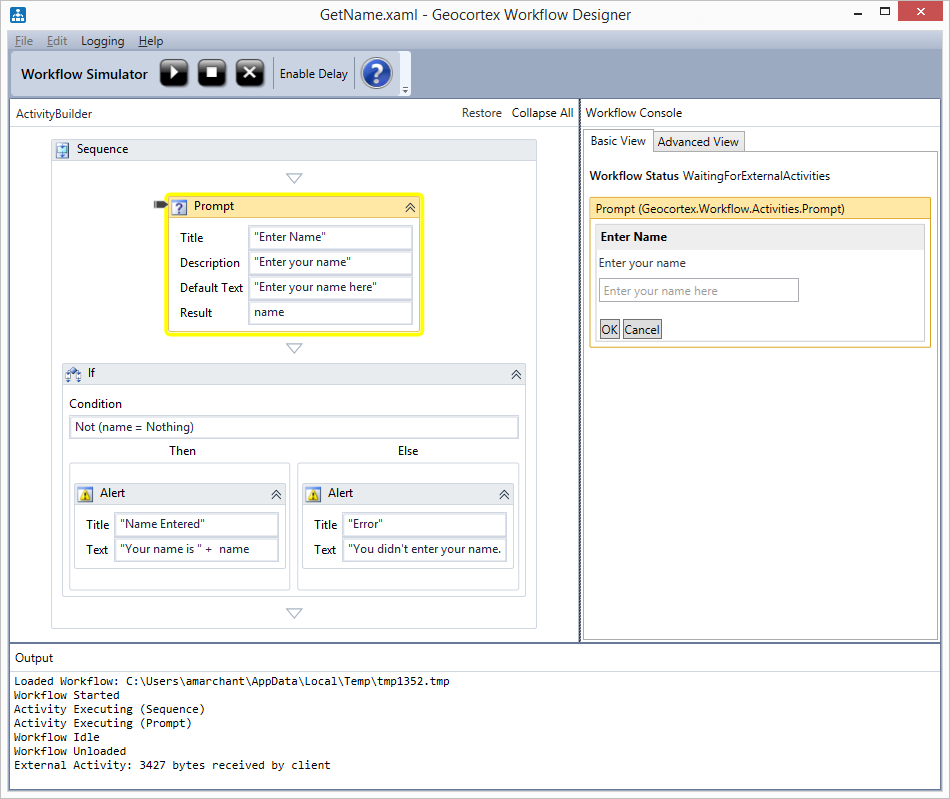
Workflow paused at the Prompt activity
-
-
To simulate the user input, type a name such as Kelly in the Prompt's text box and click OK. Alternatively, if you are comfortable with JSON, you can edit the JSON on the Advanced View tab to simulate the client's response to the server, and then click Start
.The workflow resumes, finishes the Prompt activity, and then executes the If Condition. Because the Condition is true (in other words, you entered some text in the Prompt's text box), the Then branch's activity executes. The screen capture shows the state of the workflow when the Alert activity is waiting for the user to respond:
-
The ActivityBuilder shows that the Alert activity in the Then branch is executing.
-
Like the Prompt activity, the Alert activity executes on the client. The Output area indicates that the client has received the information that the client requires to execute the Alert activity (
External Activity: 3158 bytes received by client). The server unloads the workflow while it waits for a response from the client. -
The Workflow Console's Basic View tab shows the workflow's status as
WaitingForExternalActivities, indicating that the workflow has paused. Below the status, the Console shows a simulation of the alert. The Advanced View tab shows the JSON that the server sent to the client for the Alert activity.
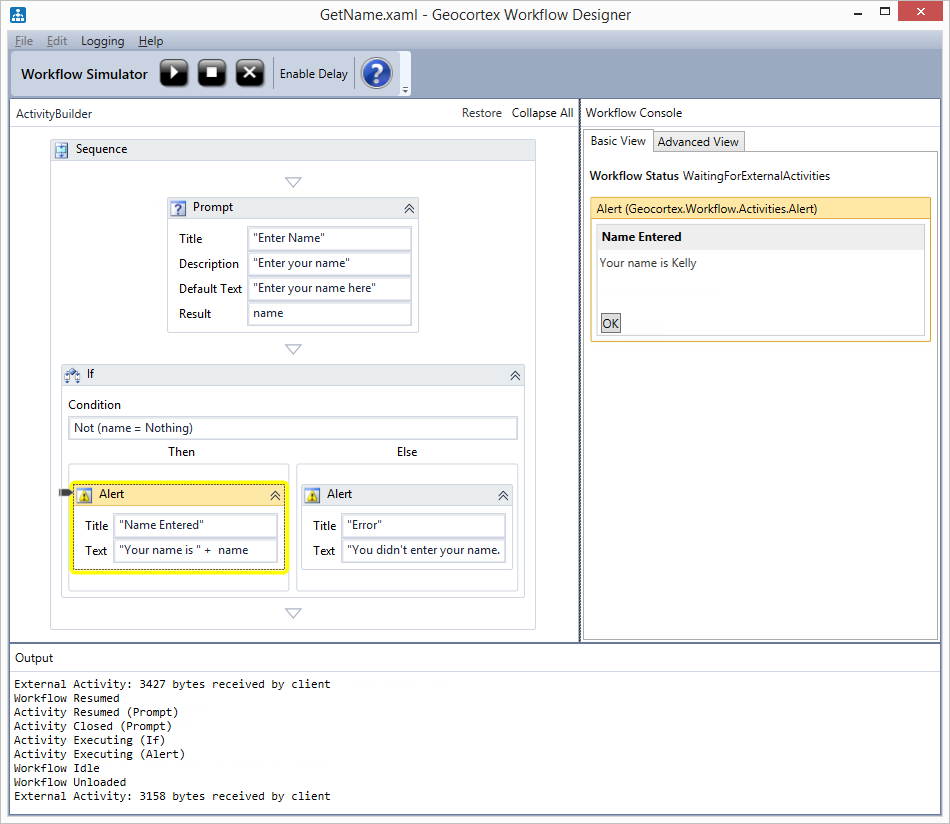
User input echoed back to the user
-
-
To simulate the user response, click OK in the alert.
The workflow resumes and finishes the Alert, If, and Sequence activities. This is the end of the workflow. The status is set to Completed and the server notifies the client that the workflow is completed (
External Activity: 156 bytes received by client).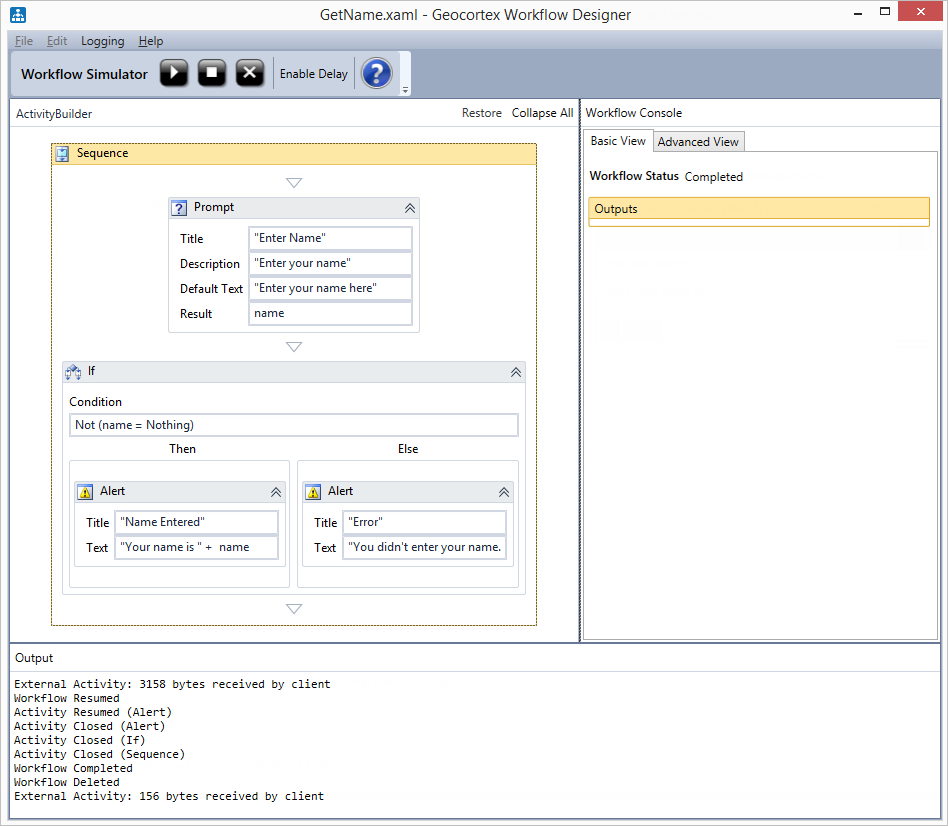
Workflow completed
-
To stop the simulation, click Stop
 .
. -
If you want to rerun the workflow, click Start
. -
To exit the Simulator, click Exit
.
Use JSON Snippets to Provide Simulated Data
You can add your own JSON data to Workflow Designer for use with the Workflow Simulator. You can use your data in Workflow Simulator whenever a workflow requires JSON for an external activity.
Your JSON snippets can be saved to XML in the same folder where the Geocortex Workflow Designer application is. The Workflow Designer looks for file names that match *JsonSnippets*.xml, where the *s are wildcards. For example, Workflow Designer would recognize your JSON snippets with the filenames MyJsonSnippets.xml or JsonSnippets_Custom.xml.
The JsonSnippets_Default.xml is overwritten whenever Geocortex Essentials is updated. We recommend that you create additional files in the Workflow Designer\ folder for your JSON snippets.
For a typical installation, you can find Workflow Designer at the following location:
C:\Program Files (x86)\Latitude Geographics\Geocortex Essentials\Default\Workflow Designer\Geocortex.Workflow.Designer.exe
Snippet Format
For Workflow Designer to recognize your JSON, nest your data within the <![CDATA[ ]]> tag in the following XML format:
<?xml version="1.0" encoding="utf-8"?>
<Snippets>
  <Snippet DisplayName=""
  TypeName="">
    <![CDATA[
    ]]>
  </Snippet>
</Snippets>
You can optionally set the <Snippet>'s DisplayName and TypeName properties:
-
DisplayName: Optional. The name of the snippet in Workflow Designer. If a display name is not provided, the JSON is displayed instead.
-
TypeName: Optional. The argument type that the JSON can be used with. If not set, the JSON can be used with any type. See Data Types for a list of argument types.
Here is an example of a valid JSON snippet in XML, as included in the JsonSnippet_Default.xml:
<?xml version="1.0" encoding="utf-8"?>
<Snippets>
  <Snippet DisplayName="Latitude Geographics Victoria Office (Web Mercator)"
  TypeName="ESRI.ArcGIS.Client.Geometry.MapPoint">
    <![CDATA[
      { "x" : -13733440.0, "y" : 6177940.0, "spatialReference" : { "wkid" : 102100 } }
    ]]>
  </Snippet>
</Snippets>
Add Breakpoints
Breakpoints are locations in a program where the program pauses execution so the programmer can perform some debugging. While the program is paused, the programmer can examine the values that the program is operating on. Tracing how the values change as the program executes helps the programmer to locate errors in the program.
You can add breakpoints to activities in a workflow when the workflow is loaded in the simulator. When you run the workflow, the simulator pauses the workflow at the beginning of each activity that has a breakpoint. This allows you to examine the inputs to the activity. The simulator also pauses the workflow when the activity completes, so you can examine the activity's output values.
While breakpoints are easy to add and remove, interpreting the data at each breakpoint can require an advanced knowledge of the object model.
To add a breakpoint to an activity:
-
Open the workflow in Workflow Designer and click Start Simulator
. -
In the Activity Builder area, right-click the activity's title, select Breakpoint, and then select Insert Breakpoint.
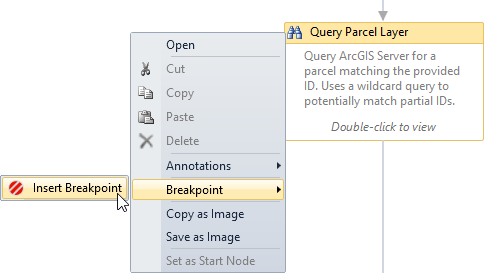
Add a breakpoint to the Query Parcel Layer activity
Alternatively, click the activity's title and press F9.
A striped dot appears beside the activity to indicate that the activity has a breakpoint.
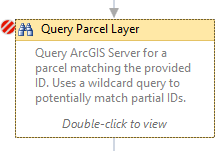
Breakpoint indicator on the Query Parcel Layer activity
You can also add breakpoints after you have started the workflow running.
To remove a breakpoint from an activity:
-
In the simulator, right-click the activity's title, select Breakpoint, and then select Delete Breakpoint.
Alternatively, click the activity's title and press F9.
To debug an activity with a breakpoint:
-
In the simulator, add breakpoints to the desired activities.
-
Click Start
to begin the simulation. When the simulation reaches the start of an activity with a breakpoint, a dialog opens to display the values of the variables and arguments being passed into the activity.
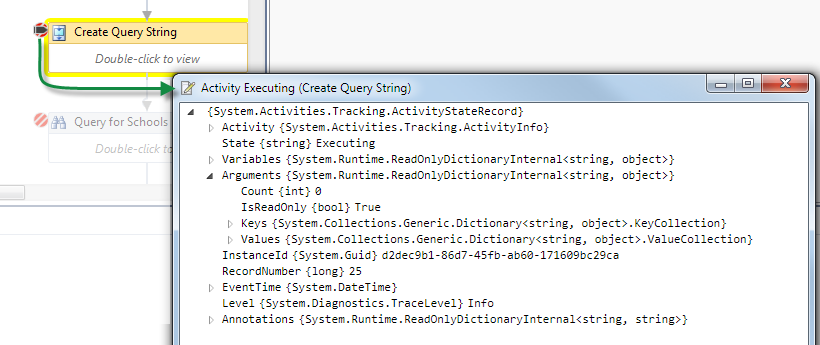
The title of the dialog indicates that the activity is still executing. This dialog presents an object graph of the current state of the activity. The type of the object being presented is an ActivityStateRecord. See ActivityStateRecords for more information.
You can drill down into the arguments to examine the values in detail.
-
To continue the simulation, do one of the following:
-
Click
 to close the dialog box.
 -
Press F5.
A second dialog appears showing the output results of the activity.
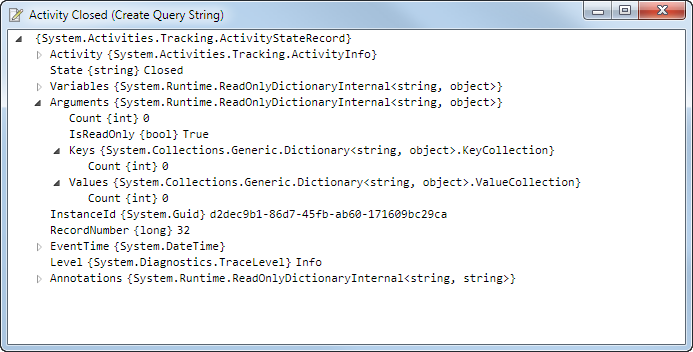
The title of the dialog indicates that the activity is closed.
-
-
To continue the simulation, do one of the following:
- Click to close the dialog box.
- Press F5.
- Click
-
To end the simulation, click
.
Configure Logging
The Logging menu allows you to set the application log level for the simulator to use. In a production environment, the application's log level is set in Geocortex Essentials Manager. When you run a workflow in the simulator, the application's log level is simulated using the log levels in the Logging menu.