Report Templates
Main Steps to Create and Use a Report Template
You may want to adapt one of the report templates that ship with the LA County sample site. In the default Essentials installation, the report templates are here:
C:\Program Files (x86)\Latitude Geographics\Geocortex Essentials\Default\REST Elements\Sample Sites\LA_County\Resources\TemplateReports
The main steps to create a report template and use it in a site are:
-
In Geocortex Report Designer, design the report template.
-
Save the template to the
Sitesfolder. -
In Geocortex Essentials Manager, add the template to the site.
-
Edit the template in Manager and configure its settings.
Design a Report Template
The general procedure to design a report template is:
-
Open the desired panel at Essentials Report Designer's left side: Controls or Geocortex Essentials.
-
Drag a control from the left panel to the design area.
-
Click the control to select it.
-
To move the selected control, drag it across the design area.
-
To resize the selected control, drag the control's handles.
-
Configure the selected control 's properties in the panel at Essentials Report Designer's right.
To display feature data in the generated report, set the control's DataField property to the name of the data field.
-
Repeat this procedure until you have added and configured all the controls that you want in the template.
See also...
Add a Report to an Essentials Site
To add a report to a layer:
-
In
 next to the layer.
 -
Click the Reports tab.
-
Click Add Report.
-
In the Display Name box, type a display name for the report.
The display name can contain spaces and special characters.
-
In the Description box, type a description for the report.
-
If the report template includes one or more feature maps, select the Include Feature Maps checkbox.
-
If the report template references one or more data links, select the Perform Data Linking checkbox.
-
Click Next.
-
If the report template (
.rpxfile) has not yet been placed somewhere within theSitesfolder, upload it now:-
In the Filename list, open the folder that you want to upload the file to.
-
Click Upload.
-
Click Select.
-
Browse to the file that you want to upload and select it.
-
Click Open.
-
Click Upload.
-
-
Browse to the report template and select it.
-
Click Finish.
The report is added to the list of reports on the Reports tab.
-
To configure additional settings, edit the report.
For example, you can configure the output formats that users can choose from.
-
Click Save Site.
Import Report Templates from Another Site
To import reports from another site:
-
In
next to the layer. -
Click the Reports tab.
-
Click Import Reports.
-
Select the site where the reports are configured, and then click Next.
-
Select the map service that contains the layer where the reports are configured, and then click Next.
-
Select the layer where the report is configured, and then click Next.
-
Select the reports that you want to import.
To select multiple reports, hold the Ctrl key down while selecting.
-
Click Finish.
The reports are added to the list of reports on the Reports tab.
-
Click Save Site.
Edit a Report in Geocortex Essentials Manager
To edit a report:
-
In
next to the layer. -
Click the Reports tab.
-
Click the Edit icon
 next to the report that you want to edit.
 -
Edit the report's settings.
-
Click Apply Changes.
Report Settings
Reports have the following settings in Essentials:
-
ID: (information only) The ID that uniquely identifies this report.
The ID is automatically generated.
-
Display Name: The report's display name.
The display name can contain spaces and special characters.
-
Description: An optional description of the report.
-
Location: The URI to the report template (
.rpxfile). Click Browse to browse theSitesfolder for the template. -
Order By: Specifies how to order the features when the report includes more than one feature. The features are ordered by the value of the specified field, in either ascending or descending order.
For example, to order tax parcels by decreasing value (field name: VALUE), enter VALUE DESC in the Order By box. To order tax parcels in A to Z order by the owner's last name (field name: OWNERLAST), enter OWNERLAST ASC.
To find out the field names, open the REST API Sites Directory and navigate to the layer that the report belongs to.
-
Perform Data Linking: If the report template contains references to one or more data links, select the Perform Data Linking checkbox. If the Perform Data Linking checkbox is cleared, external data will not appear in the report.
Do not select the Perform Data Linking checkbox if you do not need to, as it can affect performance.
-
Include Feature Maps: If you have included one or more feature maps in the report template, select the Include Feature Maps checkbox. If the Include Feature Maps checkbox is cleared, the feature maps will not appear in the report.
Do not select the Include Feature Maps checkbox if you do not need to, as it can affect performance.
-
Output Formats: The file formats that can be used for the report. Select the checkbox for each format that you want to be available to users. If you select more than one format, users must select which format they want to use before the report is created. Note that print jobs support PDF reports only.
-
Transform Workflow URI: The URI of a DataSet Workflow that modifies the data set for the report before the report is created. If you have created a DataSet Transform workflow, enter the workflow's location. For more information, see Create a DataSet Transform Workflow.
-
Visible: Controls whether the report appears in the list of reports available to be run in the viewer. In the HTML5 Viewer, a user runs reports using the Run a Report option in the Panel Actions menu of the results list, results table, or in map tips.
-
Print Job Settings: Print jobs allow background processing. When you enable print jobs for a report, the report is created in the background and the user is optionally notified of the job's status by email. If the report is large or contains a lot of data, enabling print jobs prevents report creation from timing out. Only PDF reports can be created in the background—background printing does not support the other output formats.
-
Enable Print Jobs: Controls whether the report is created in the background. If the report is large or complex, select the Enable Print Jobs checkbox to prevent report creation from timing out.
-
Email Settings Tab:
-
To allow the user to be notified by email when report creation starts and ends, select the Enable Email Notifications checkbox.
-
Sender Email Address is the address that appears in the From field of notification emails to the user.
-
Sender Name is the name that appears in the From field of notification emails to the user.
-
-
Message Settings Tab:
If the settings on the Message Settings tab are grayed out, select the Enable Email Notifications checkbox on the Email Settings tab.
-
Printing Start Subject is the text that appears in the subject field of notification emails to the user when report creation starts.
-
Printing Start Message is the text that appears as the message of notification emails to the user when report creation starts. A link to the status page is automatically appended to the message.
-
Printing Success Subject is the text that appears in the subject field of notification emails to the user if report creation succeeds.
-
Printing Success Message is the text that appears as the message of notification emails to the user if report creation succeeds. A link to the status page is automatically appended to the message.
-
Printing Failure Subject is the text that appears in the subject field of notification emails to the user if report creation fails.
-
Printing Failure Message is the text that appears as the message of notification emails to the user if report creation fails. A link to the status page is automatically appended to the message.
-
-
SMTP Settings Tab:
If the settings on the SMTP Settings tab are grayed out, select the Enable Email Notifications checkbox on the Email Settings tab.
-
SMTP Server Host is the host name of the SMTP server.
-
SMTP Server Port is the port on the SMTP server. The default port is 25.
-
SMTP Server Username is the username used to access the SMTP server. If a username is not required, leave this setting blank.
-
SMTP Server Password is the password used to access the SMTP server. If a password is not required, leave this setting blank.
-
-
Configure a Report to be Created in the Background
Web servers and browsers place a time limit on web requests. Normally, reports run with a single request and complete within the time limit. However, reports that are particularly large or contain a lot of data can take much longer.
To ensure that a large or complex report does not time out, you can configure the report to be created in the background. When a report is configured for background creation, you can configure email settings to notify the user when report creation starts and ends.
Only PDF reports can be created in the background.
To configure a report to be created in the background:
-
In
next to the layer. -
Click the Reports tab.
-
Edit the report that you want to configure.
-
Click Edit Print Job Settings.
-
To turn on background report creation, select the Enable Print Jobs checkbox.
-
Click the Email Settings tab to manage email notifications:
-
To allow the user to be notified by email when report creation starts and ends, select the Enable Email Notifications checkbox.
-
Sender Email Address is the address that appears in the From field of notification emails to the user.
-
Sender Name is the name that appears in the From field of notification emails to the user.
-
Click the Message Settings tab to modify the text of notification emails to the user:
-
Printing Start Subject is the text that appears in the subject field of notification emails to the user when report creation starts.
-
Printing Start Message is the text that appears as the message of notification emails to the user when report creation starts. A link to the status page is automatically appended to the message.
-
Printing Success Subject is the text that appears in the subject field of notification emails to the user if report creation succeeds.
-
Printing Success Message is the text that appears as the message of notification emails to the user if report creation succeeds. A link to the status page is automatically appended to the message.
-
Printing Failure Subject is the text that appears in the subject field of notification emails to the user if report creation fails.
-
Printing Failure Message is the text that appears as the message of notification emails to the user if report creation fails. A link to the status page is automatically appended to the message.
-
Click the SMTP Settings tab to edit the SMTP server settings for sending status emails:
-
SMTP Server Host is the host name of the SMTP server.
-
SMTP Server Port is the port on the SMTP server. The default port is 25.
-
SMTP Server Username is the username used to access the SMTP server. If a username is not required, leave this setting blank.
-
SMTP Server Password is the password used to access the SMTP server. If a password is not required, leave this setting blank.
-
Click OK.
-
Click Save Site.
Feature Maps
A feature map is an image that shows a particular feature on a feature layer. Feature maps are used in reports to provide context. When an end user runs the report, a feature map of the currently selected feature is included in the report. The selected feature appears in the center of the map image. The map itself and any visible layers also appear on the feature map, just as they are configured in the Essentials site. This allows the user to see the feature and its surrounding area.
The following screen capture shows a feature map in a report for a tax parcel. The feature map is circled. The parcel in the feature map is highlighted cyan.
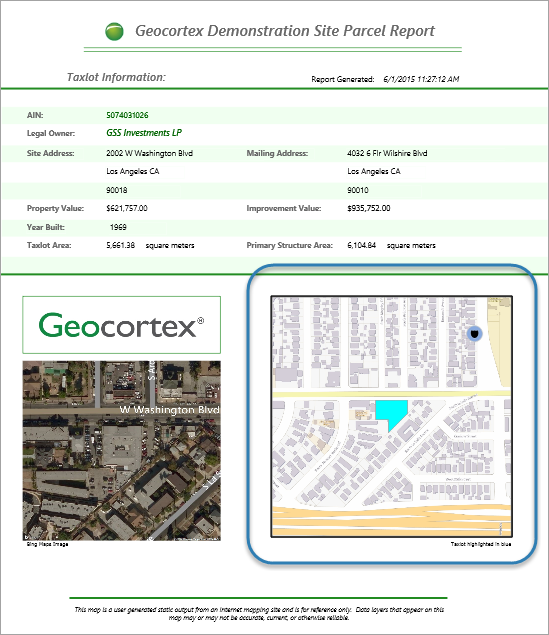
Parcel report with a feature map showing the selected parcel
Main Steps to Create and Use a Feature Map
The main steps to create a feature map and use it in a report template are:
-
In Geocortex Essentials Manager, add a feature map to the layer that the report belongs to.
Alternatively, if you already have a feature map for this layer in another site, you can import the feature map.
-
In Report Designer, add the feature map to the report template
-
In Geocortex Essentials Manager, make sure that the report's Include Feature Maps checkbox is selected.
Add a Feature Map to a Layer
To add a feature map to a layer:
-
In
next to the layer. -
Click the Feature Maps tab.
-
Click Add Feature Map.
-
In the Display Name box, type a display name for the feature map.
The display name can contain spaces and special characters.
-
Click Apply.
This generates the feature map's ID. The ID appears immediately above the display name.
-
Take note of the feature map's ID.
You will need the ID when you add the feature map to the report template.
-
If you want to zoom the feature map out from the feature to show more of the surrounding area, enter a distance in the Buffer Distance box and select the units.
Click Apply to see a preview. Repeatedly change the buffer distance and click Apply until you are happy with the buffer distance shown in the preview.
-
If you want to change the highlight color, enter the color's hexadecimal value (for example, #EE82EE) or HTML color name (for example, violet) in the Highlight Color box. Click Apply to refresh the preview.
Alternatively, click the color picker
 and select the new color from the color map.
 -
To adjust the opacity of the highlighting, drag the Opacity slider. Click Apply to refresh the preview.
-
To turn off highlighting, clear the Highlight Feature checkbox.
-
In the Resolution box, change the resolution of the feature map image if you want. The resolution is in pixels per inch.
The default resolution is appropriate for viewing the report on screen.
-
Click OK.
The feature map is added to the list of feature maps on the Feature Maps tab.
-
Click Save Site.
To reorder list items, click and drag the Sort handle ![]() .
.
Import Feature Maps from Another Site
To import feature maps from another site:
-
In
next to the layer. -
Click the Feature Maps tab.
-
Click Import Feature Map.
-
Select the site where the feature maps are configured, and then click Next.
-
Select the feature maps that you want to import.
To select multiple feature maps, hold the Ctrl key down while selecting.
-
Click Finish.
The feature maps are added to the list of feature maps on the Feature Maps tab.
-
Edit each imported feature map and adjust the settings as needed to make the imported settings work in this layer.
For example, the buffer distance could exceed the scale range of the layer that you imported the feature map into.
-
Take note of each feature map's ID.
You will need the IDs when you add the feature maps to report templates.
-
Click Save Site.
To reorder list items, click and drag the Sort handle ![]() .
.
Feature Map Settings
Feature maps have the following settings:
-
ID: (information only) The ID that uniquely identifies this feature map.
The ID is based on the display name that you enter when you create the feature map. Special characters are removed and spaces are converted to underscores. You use the ID to reference the feature map in the report template.
-
Display Name: The feature map's display name.
The display name can contain spaces and special characters.
-
Buffer Distance: Controls how much of the surrounding area around the feature to show in the feature map, in other words, how far to zoom out from the feature. If the buffer distance is 0 (zero), the feature extends to the edges of the feature map. The higher the buffer distance, the farther out the feature map is zoomed.
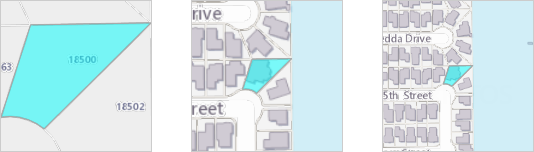
Feature maps with a buffer distance of 0 (left), 50 m. (center), and 100 m.
The default buffer distance is 0 (zero). Using a buffer distance helps readers to orient themselves within the feature's larger context.
Click Apply to see a preview of the buffer distance that you have chosen. The preview also shows the highlight color and opacity.
-
Highlight Color: The color to highlight the feature. Enter the highlight color using hexadecimal notation (for example, #FFA500) or the HTML color name (for example, orange). Alternatively, click the color picker
to select the color from a color map. The Highlight Color setting has no effect if Highlight Feature is disabled. -
Opacity: The opacity of the highlighting, on a scale of 0 (transparent) to 255 (fully opaque). Drag the slider to change the opacity. The color picker's opacity changes to reflect the opacity that you have selected. The Opacity setting has no effect if Highlight Feature is disabled.
-
Highlight Feature: Controls whether the feature is highlighted in the feature map. If you do not want the feature to be highlighted, clear the Highlight Feature checkbox.
-
Resolution: The resolution to use for the feature map image, in pixels per inch. The default resolution, 96 ppi, is appropriate for viewing the report on a computer. If users might print the report, you may want to increase the resolution.
Add a Feature Map to a Report Template
To add a feature map to a report template:
-
In Essentials Report Designer, open the report that you want to add the feature map to:
-
New Report: If the report template does not exist yet, click File | New.
-
Existing Report: If the report template already exists, click File | Open and open the report template.
Report templates are
.rpxfiles. They are stored in theSitesfolder.
-
-
Drag a Picture control from the left panel to the desired position on the design surface.
If there is no Picture control, the Geocortex Essentials-specific controls may be open. Click Controls to open the standard controls.
-
Drag the Picture's handles to adjust its size to the size that you want the feature map.
-
Make sure that the Picture is selected on the drawing surface.
This displays the Picture's properties in the right panel.
-
Configure the Picture's properties:
-
In the Data area, set DataField to the feature map's ID.
This puts the feature map into the Picture control. If you do not know the feature map's ID, edit the layer in Manager and click the Feature Maps tab to see the ID.
-
In the Behavior area, make sure that Visible is set to True.
If Visible is False, the feature map will not appear in the report.
-
If you want the feature map to have a border, configure the LineColor, LineStyle and LineWeight properties in the Appearance area.
The Picture's properties will look something like this:
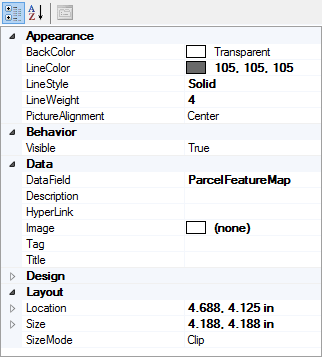
Example configuration for a Picture that contains a feature map
-
-
To add a caption to the feature map, drag a TextBox control below the Picture on the design surface and set the Text property in the Data area to the caption's text.
-
Save the report template.