Introduction to Geocortex Essentials Reporting
Geocortex Essentials reports are used to publish information about the currently selected features in a particular layer. Reports can include attribute data, linked data, images, maps, charts, and more.
The report shown below includes data related to the feature that the end user has identified (top), an aerial photo (bottom left), and a feature map (bottom right).
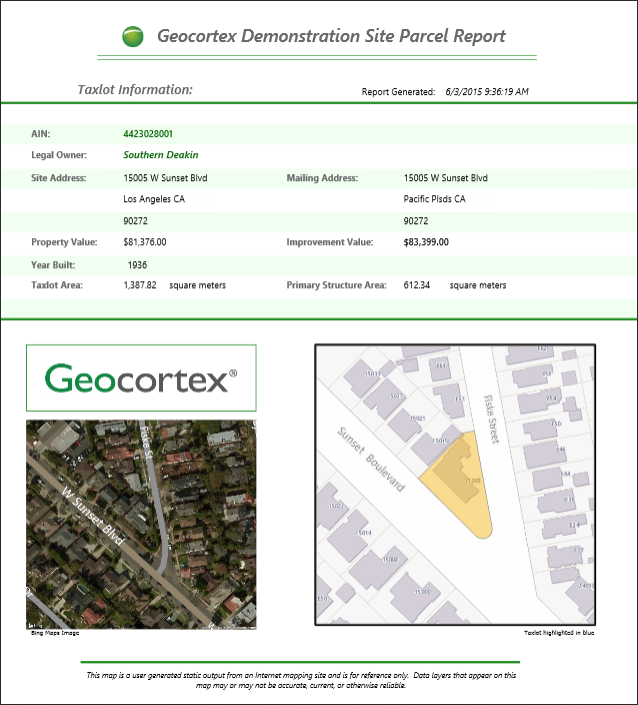
Example of a report that reports on a tax parcel
Templates
Reports are generated from templates (.rpx files) that you create in Geocortex Report Designer. Report Designer provides a design surface where you lay out and format the elements that you want in the report.
There are two types of template:
-
Report Templates: Report templates are used to report on the data from a particular map layer. Report templates can also include images, text, and other layout elements. Because they report on layer data, report templates are associated with a layer in Essentials.
-
Print Templates: Print templates are a special type of report template in which the main part of the output is an image of the map. Print templates can include elements like an overview map, title and description, north arrow, scale bar, legend, and charts. Print templates are associated with a site in Essentials.
When a user chooses to generate a report based on selected features or print the map, Geocortex Essentials supplies the data and other content to the reporting engine at runtime. The reporting engine merges the data and other content with the report template to create printable output.
You can configure the output formats that users can use for a particular template, for example, PNG, PDF, or RTF. The primary output format for reporting in Geocortex Essentials is PDF since that format is designed to correspond well to output from a printer.
Main Steps to Create a Report
The main steps to create a template and make it available in a viewer are:
-
In Geocortex Report Designer, design the template.
You may want to adapt one of the templates that ship with the LA County sample site. In the default Essentials installation, the sample site's templates are here:
C:\Program Files (x86)\Latitude Geographics\Geocortex Essentials\Default\REST Elements\Sample Sites\LA_County\Resources\
Report templates are in the
TemplateReportsfolder. Print templates are in thePrintTemplatesfolder. -
Save the template to the
Sitesfolder. -
Use Geocortex Essentials Manager to add the template to the site.
A report template is added to the layer whose data it reports. Print templates are added at the site level.
-
Edit the template in Manager and configure its settings.
For example, you can configure the output formats that users can select from.
-
Provide a way to end users to generate the report from the viewer.
HTML5 viewers have a built-in Run a Report option that users can use to run report template reports. The Run a Report option is in the Panel Actions menu of the results list, results table, or in map tips. For more information, see Reporting Module.
To allow users to generate a print template's report, you can add the Print tool to the viewer's toolbar, add an item to the I Want To menu, or provide a hyperlink or workflow that runs the report.
Geocortex Report Designer
Report Designer is an easy-to-use WYSIWYG editor that allows you to lay out sophisticated, professional-looking report and print templates. End users use the templates you create in Report Designer to generate print-ready reports and maps on demand.
Templates have two aspects: the layout and data references. When a report or printable map is generated, the data references included in the layout's controls are populated with the current data values. Since data binding occurs at run-time, reports and maps are guaranteed to contain the most recent data.
There are three types of data that can be included in a template:
-
Layer data: data about the features of a layer
-
Linked data: data from an external data source
-
Map data: images that comprise a print-ready map, such as the map image, title and scale bar
Typically, layer and linked data are used in report templates and map data is used in print templates. Strictly speaking, a template can only contain one type of data. However, templates can be nested, so in practice there is no limitation on how you combine types of data in reports and maps.
The templates created by Report Designer are .rpx files, the file format of .NET's ActiveReports reporting tool.
Installation
Geocortex Essentials Report Designer is installed when you install Geocortex Essentials.
Launch Essentials Report Designer
To launch Geocortex Essentials Report Designer:
-
Windows Server 2012 or Windows 8, and Newer Versions:
In the Start menu, type (Undefined variable: GE.Geocortex), and then click Geocortex Essentials Report Designer.
-
Windows Server 2008 or Windows 7, and Older Versions:
In the Start menu, select All Programs | VertiGIS | Geocortex Essentials [Version] [Instance] | Geocortex Essentials Report Designer.
[Version] is the Essentials version number. [Instance] is the instance name, if Essentials is installed as a named instance. The default installation does not have an instance name.
Design Interface
The Report Designer has several key areas that make it easier to use. The numbers in the image indicate the parts of the interface that you should be familiar with.
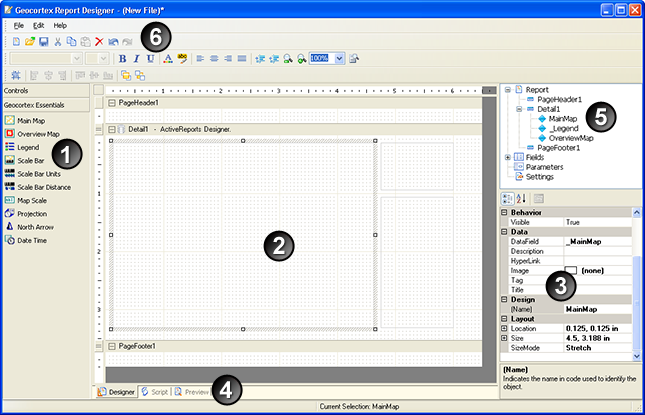
The Report Designer

|
The toolbox has two panels that contain controls you can add to your templates. The Geocortex Essentials panel (shown above) contains controls for creating printable maps, such as the map image, scale bar and legend. These controls are automatically bound to your map data. The Controls panel contains controls that can be bound to data, such as text boxes and subreports, as well as generic design controls like lines and shapes. |

|
The design area has drag-and-drop controls that allow you to drag a tool from the toolbox onto the Design Area to add the controls to your template. Adjust the size and position of controls right on the Design Area. |

|
In the properties area, select a control to view its properties. Click a property to edit its value. The DataField property is used to attach data to your template. |

|
The tabs allow you to switch between Designer view and Preview view by clicking the tabs. |

|
The list of controls makes it possible to open the Report node and expand the branches to see a list of the controls in your template. Click a control in the list to select the control in the design area. |

|
The menus and toolbars provide file management, editing tools, and commands. The report settings dialog is invoked by double-clicking on the Settings node in the control navigator, or by selecting Report Settings from the File menu. |
Architecture
The reporting architecture in Geocortex Essentials is based on the third-party ActiveReports control from GrapeCity Inc. The ActiveReports architecture allows Essentials administrators to create powerful report templates in a WYSIWYG design environment, which are then processed into printable reports containing map and tabular data from the end user's mapping session.