Clustering
The Essentials Clustering feature is only available for ArcGIS Server feature layers.
If the features in a feature layer are close together at the current zoom level, their symbols overlap. This makes the features difficult to distinguish. Clustering resolves this issue by using a single symbol to represent features that are close together. The cluster symbol displays the number of features that it represents. Users can click a cluster symbol to see the feature descriptions of the features in the cluster. Panning or zooming the map updates the clusters.
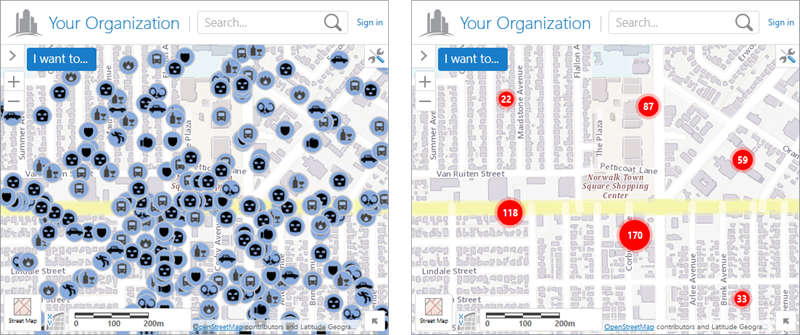
Crime data unclustered (left) and clustered (right)
You can configure the default visibility of clustering, and you can enable end users to turn clustering on and off.
Clustering works for feature layers from feature services only. It does not work for feature layers from map services or for other types of service or layer.
Clustering is one method of visualizing data. Heat maps offer another method.
When a user clicks a cluster symbol in an HTML5 viewer, the cluster symbol is replaced by the symbols for the individual features and all of the other clusters are hidden. A map tip that lists the cluster's features opens as well.
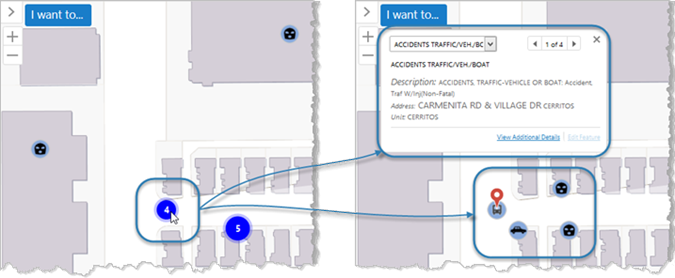
Clicking a cluster symbol (left) shows the individual features and a map tip (right)
Cluster symbols show in the map legend and in legend swatches in the Layer List. At most four cluster symbols show.
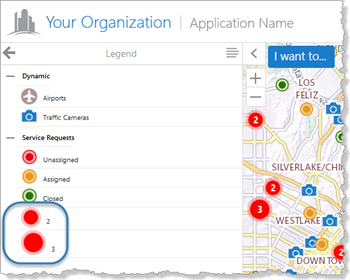
Cluster symbols in the map legend
Viewers support exporting, printing, and reporting of map images with clusters. Exporting the map image when clusters show on the map produces an image that is nearly identical to the map image in the viewer. Map images in printouts and reports may not look exactly like the map in the viewer. The map image has to fit in the frame that is defined in the print or report template, and the frame's proportions may be different than the map's proportions in the viewer. As well, the scale in the viewer may be different than the scale that is used to produce the printout or report. Printing and reporting recalculate the clusters so the clusters are accurate for the scale and proportions used in the printout or report.
Viewers support clustering on point layers only. Viewers do not support clustering on line and polygon layers.
You may want to remove clustering from line and polygon feature layers. If you allow end users to turn on clustering for a line or polygon layer, it will not have any effect on the map.
Clustering Settings
Clustering has the following settings:
-
Enabled: Specifies whether clustering is initially turned on or off. If you want features to be clustered when end users first view the layer, select the checkbox. By default, clustering is turned off initially.
If you enable clustering, make sure that heat maps are disabled for this layer—clustering and heat maps cannot both show at the same time.
-
User Can Enable/Disable: Specifies whether end users can turn clustering on and off. Enabling this setting also allows users to change the radius and maximum cluster size. By default, users can turn clustering on and off. If you do not want users to be able to turn clustering on and off, clear the checkbox.
If you do not want users to be able to turn clustering off, you must clear the User Can Enable/Disable checkboxes for both clustering and heat maps. When a user turns on heat maps, clustering turns off, regardless of whether users can enable and disable clustering. The screen capture below shows the configuration to use if you do not want users to be able to turn clustering off by any means.
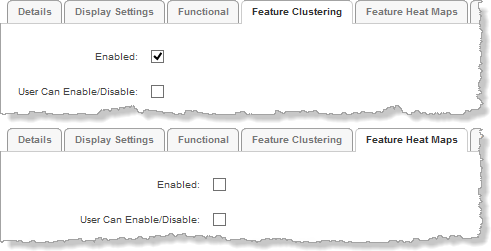
Settings to use if you want clustering always turned on
-
Background Color: Sets the fill color of the cluster symbol. Click the color picker
 to select a color, or type in the color's HTML name (for example, red) or hex value (for example, #FF0000). The default is red.
 -
Label Color: Sets the color of the number on cluster symbols. Click the color picker
 to select a color, or type in the color's HTML name (for example, white) or hex value (for example, #FFFFFF). The default is white.
 -
Radius: Defines the maximum screen area within which features can be clustered in a single cluster. Increasing the radius can include more features in each cluster. Decreasing the radius can reduce the number of features in each cluster. If there is exactly one feature within the specified radius, the feature is represented on the map using the default symbol instead of a cluster symbol. The default radius is 20 pixels.
-
Cluster Size: Specifies the maximum number of features that can be included in a cluster. If there are more than Cluster Size features within the area defined by Radius, multiple cluster symbols show for that radius.
If you set Cluster Size to 0 (zero), there is no upper limit on the number of features in a cluster. The default cluster size for HTML5 viewers is 0.
Configure Clustering
To configure clustering:
-
In
Make sure you edit the feature layer's map service component, not the layer component.
-
Click the Feature Clustering tab.
-
Configure the settings.
-
Click Apply Settings.
-
Click Save Site.
-
Test your configuration in the viewer to make sure that the radius and cluster size are appropriate for the layer's visible scales.
The effectiveness of clustering depends on balancing the radius with the cluster size, so the clusters are dense enough but not too dense at the layer's visible scales.
Remove Clustering from a Layer
When you remove clustering from a layer, end users cannot turn clustering back on.
To remove clustering from a layer:
The HTML5 Viewer does not support clustering on line and polygon layers. You may want to remove clustering from line and polygon feature layers. If you do not remove clustering, users will be able to select clustering in the Visualization Options panel, but it will not have any effect.
-
In
Make sure you edit the feature layer's map service component, not the layer component.
-
Click the Feature Clustering tab.
-
Clear the Enabled checkbox.
-
Clear the User Can Enable/Disable checkbox.
-
Click Apply Settings.