UploadData Module
The UploadData module implements the ability for users to upload files containing spatial or address data to the Geocortex Core Document Store. Once uploaded, the data is served as a new feature layer. If the uploaded data is published to ArcGIS Online or Portal for ArcGIS, the data can be queried and filtered. The user can interact with the data as they could any other feature layer.
The user who uploaded the data is the only user who can view it, and when the user's session ends the data is removed from the map. In this case, the data is automatically deleted from the Document Store in one hour. However, the following methods enable users to share data across sessions:
The UploadData Module is not available in offline mode.
The UploadData functionality is not available to iOS users because of file system security policies that limit access to files and directories.
Add and Remove Uploaded Data
Data files with spatial or address data can be uploaded by users via the Upload Data tool. The Upload Data tool is configured from the Toolbars page in Manager.

Upload Data tool
Add a User-Added Layer
A wizard guides users through the upload process. The dialog boxes appear in the following order:
-
The Add Data to Map upload form.
The user browses their file system for files to upload.
The UploadData module only supports multiple simultaneous uploads for shapefiles. When a single shapefile is uploaded, the upload dialog box will allow users to name the layer. When more than one shapefile is uploaded at once, the layers are named:
<name>,<name> (0),<name> (1), and so on. -
The Table Mapping Details dialog box.
If the user uploaded a XLSX or CSV file, they must identify the uploaded data's geographical information. For more information, see Table Mapping Details.
-
The Layer Details dialog box.
The user creates a name for the new layer.
-
The Table Record Results dialog box.
The viewer alerts the user whether each table record passed or failed.
-
The Symbolize Data dialog box.
The user modifies how the new layer is represented on the map. The user can choose the color, size, and shape of the layer's symbols. For more information, see Symbolize Data.
The user-added layer appears at the top of the layer list, unless you have specified that user-added layers should appear within a configured folder. For more information, see The Layer List.
To remove a user-added layer, the user presses the ![]() Layer Actions button next to the user-added layer and clicks the Remove Layer action.
Layer Actions button next to the user-added layer and clicks the Remove Layer action.
Projects allow users to save viewer sessions, share the sessions, and reload them later. A user can save uploaded data and load it in another session saving their session using the Projects panel. For more information about this feature, see Project Module.
Publish Data to ArcGIS Server or Portal for ArcGIS
The user can choose to publish the uploaded data to their ArcGIS Online or Portal for ArcGIS account if they are logged in. If the user has not been granted publishing privileges in ArcGIS Online or Portal, the user's data cannot be published. The data is published as a feature service. When the data is published, it is also stored in the user's content.
In order to publish, the URL to the user's ArcGIS account must be registered in
the proxy.config whitelist:
<serverUrl url="https://organization.maps.arcgis.com/sharing/rest/" matchAll="true"></serverUrl>Where organization is the configured ArcGIS
Online organization name.
For information about publishing to ArcGIS, see ExportWebMap Module.
User-Added Layers in the Layer List
By default, user-added layers appear at the top of the layer list once added. From Manager, you can choose where your uploaded data appears in the Layer List.
To configure where user-added layers appear in the Layer List:
-
From the Map page in Manager, select the Layer List tab.
-
Select the Edit icon
 next the folder where user-added
layers should appear.
next the folder where user-added
layers should appear. -
Select the Place user-added layers here checkbox
 .
. -
Click Apply Details.
Supported File Formats
Uploaded data files require either spatial coordinates or address data. While some supported file formats include spatial data by default, CSV and XLSX files require columns in their data tables specifically for spatial coordinates (Latitude and Longitude) or address data.
The UploadData module supports uploads in the following file formats:
-
CSV: The viewer accepts CSVs in UTF-8 encoding. It accepts other encodings if the file includes a byte order mark. Both Microsoft Excel and Notepad can save CSV files in UTF-8 format.
-
XLSX
-
KML
-
GPX: GPX files cannot be published to ArcGIS Online or Portal for ArcGIS.
-
ZIP (for shapefiles and FileGDBs): The following shapefile pieces are required to successfully publish shapefile data to ArcGIS Online or Portal for ArcGIS:
-
.shp -
.shx -
.dbf -
.prj
If you do not plan to publish shapefile data, only the
.shpfile is necessary to generate shapefile data.The UploadData module only supports multiple simultaneous uploads for shapefiles. When a single shapefile is uploaded, the upload dialog box will allow users to name the layer. When more than one shapefile is uploaded at once, the layers are named:
<name>,<name> (0),<name> (1), and so on.In order to upload a FileGDB file, the user must be logged in to an ArcGIS Online or Portal for ArcGIS account.
-
The file size limit for uploaded files defaults to 20 MB. You can configure a custom file size limit in the Essentials Web.config file:
C:\Program Files (x86)\Latitude Geographics\Geocortex Essentials\Default\REST Elements\REST\Web.config
Change the File Size Limit for Uploaded Data
To change the file size limit for uploaded data:
-
Search for the string
maxAllowedContentLength. It is embedded in the following line of XML:<requestLimits maxAllowedContentLength="20971520" /> -
Configure the value of
maxAllowedContentLengthin bytes. -
Search for the string maxRequestLength. It is embedded in the following line of XML:
<httpRuntime maxRequestLength="20480" requestValidationMode="2.0" enableVersionHeader="false" /> -
Configure the value for
maxRequestLengthin kilobytes.This value should be equal to the value of
maxAllowedContentLength.
Table Mapping Details
The Table Mapping Details dialog box allows users to instruct Essentials how to parse uploaded data correctly. If the user uploaded a XLSX or CSV file, this dialog box also displays a preview of the user's uploaded data for reference.
If the table's first row is a label, Essentials will attempt to detect the X axis and Y axis for the uploaded data.
If the table's first row is not a label or the table does not include spatial coordinates, the user can choose which columns to be used for feature locations and labels.
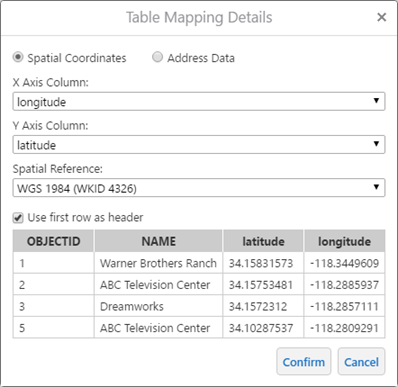
Table Mapping Details dialog box
-
Spatial Coordinates: If the uploaded file includes labelled columns with geographical coordinates (for example, columns labelled X and Y or Lat and Long), Essentials will detect this and select X Axis Column and Y Axis Column automatically.
-
By default, the Spatial Reference drop-down menu is set to WGS 1984. If you require another spatial reference system not available in the drop-down menu, you may select Custom WKID/WKT and enter a custom spatial reference in the text input box. To customize the available spatial references in this drop-down menu, see the
sourceSpatialReferencesproperty in Configuration Properties.
-
-
Address Data: If the uploaded file does not include geographic coordinates, the user can assign columns with address information to be geocoded. A geocoding service must be configured in order to use this feature. For more information, see Configure a Batch Geocoder.
-
Use first row as header: Select this checkbox if the first row of your data table functions as a label for its corresponding column.
If your data table has no labels, you can label the spatial coordinates or address data using the corresponding drop-down menus. For example, if Spatial Coordinates is selected, you can set the X Axis Column and Y Axis Column.
Automatically Detect Column Headers
When a user uploads data, Essentials needs to know which column contains the X Axis Coordinates, which column contains the Y Axis Coordinates, and so on. The software looks for commonly used headers in the data. For example, to find X Axis Coordinates, the software looks for columns called Latitude, Lat, or x. If it finds one, then the software gets the X coordinates from that column.
You can configure additional column headers for Essentials to look for using the autoDetectionTerms properties. For information, see Configuration Properties.
Configure a Batch Geocoder
If uploaded CSV or XLSX data files do not provide spatial coordinates, address data needs to be geocoded using an ArcGIS Online geocoding service. If none of your enabled geocoding services have the Default Batch Geocoder checkbox selected in their settings, Essentials cycles through your enabled geocoding services until it finds the first ArcGIS Online service listed.
All the parameters in your geocoding service's configuration are selectable in the Table Mapping Details dialog box. Once the user has selected columns to match parameters, the value is used to batch geocode the uploaded data. If the user does not select a column to match with a parameter, a parameter's default value is used.
For instructions on configuring an ArcGIS geocoding service, a default geocoding service, and default values for parameters, see Geocoding Services.
Symbolize Data
Users can symbolize layers created from uploaded data files. Symbols are chosen during the during the file upload process. If an uploaded file includes multiple layers, like a FileGDB or KML, then symbols can be chosen for each layer.
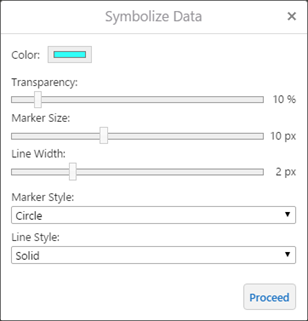
Symbolize Data dialog box
End users can re-symbolize user-added layers on the map. To re-symbolize the layer, select the Layer Actions icon ![]() next to the layer in the layer list and choose Turn on/off layer visualizations. Then, you can use the Custom Layer Styles option to re-symbolize the layer.
next to the layer in the layer list and choose Turn on/off layer visualizations. Then, you can use the Custom Layer Styles option to re-symbolize the layer.
For more information about symbolization in the viewer, see LayerStyles Module.
Data Visualization Options
Users can visualize user-added feature layers with multiple point features as heat maps or clusters. For information about heat maps and feature clustering, see Heat Maps and Clustering.
To turn on visualization, use the Layer Actions icon ![]() next to a user-added layer, then select Turn on/off layer visualizations and choose either Heat Map or Feature Clustering from the drop-down menu. When visualization is turned on, the user is presented with some visualization options.
next to a user-added layer, then select Turn on/off layer visualizations and choose either Heat Map or Feature Clustering from the drop-down menu. When visualization is turned on, the user is presented with some visualization options.
The visualization options for heat maps include:
-
Intensity: The size in pixels of the heat maps.
-
Intensity Multiplier: Multiplies the intensity level by a selected numerical field from uploaded data.
The visualization options for feature clustering includes:
-
Radius: The radius in pixels of each cluster label.
-
Maximum Cluster Size: The maximum number of features represented by a cluster.
Configuration Properties
Module
-
checkJobStatusPeriod: The period of time in milliseconds that the Viewer waits before re-checking if a file has been uploaded successfully. The default value is4000. -
heatmap: Visualizes uploaded data as a heat map.-
enabled: A boolean that defines whether user-added layers have heat maps enabled initially. The default value isfalse. -
userCanToggle: A boolean that defines whether users can toggle heat maps on user-added layers. The default value istrue. -
respectScaleRange: A boolean that defines whether a user-added layer's scale rang is respected when heat maps are enabled. The default value istrue. -
gradient: Definition for the heat map color gradient as an array of four RGBA values. The order of the array represents the order of the colors: from outermost, to outer, to inner, to innermost.The default values are
[255,255,255,0], [0,0,255,98], [255,0,0,139], [255,255,0,181]. -
offset: An array of ratios used as color stops for user-added layer heat maps. -
intensity: The default intensity to set the heat map renderer in pixels. The initial value is25. -
includeInLegend: A boolean that defines whether heat map colors appear in the map legend. The default value istrue.
-
-
cluster: Visualizes uploaded data as clusters on the map.-
enabled: A boolean that defines whether user-added layers have heat maps enabled initially. The default value isfalse. -
userCanToggle: A boolen that defines whether users can toggle clusters on user-added layers. The default value istrue. -
radius: The radius of a cluster in pixels. The default value is50. -
maximumFeatures: The maximum number of features that can make a cluster. The default value is100. -
backgroundColor: The background color of a cluster in an RGB color format. The default value is[0, 0, 255]. -
labelColor: The color of a cluster's label text in an RGB color format. The default value is[255, 255, 255].
-
Views
-
UploadDialogView: Noconfigurationproperties -
TableMappingDialogView: Noconfigurationproperties -
LayerDetailsDialogView: Noconfigurationproperties -
TableRecordResultsDialogView: Noconfigurationproperties -
SymbolDialogView: Noconfigurationproperties
View Models
-
UploadDialogViewModel: Noconfigurationproperties
TableMappingDialogViewModel:
-
autoDetectionTerms: Sets additional column headers for Essentials to look for. If a configured column header is detected, i is matched with a standard feature detail. For example, a column headerMovie Theatercould set thefeatureLabelattribute if configured to do so. Detection can be configured for the following attributes:-
xAxis: An array of used to detect X-axis coordinates from a column header. The default value is["Latitude", "Lat", "x"]. -
yAxis: An array of objects used to detect Y-axis coordinates from a column header. The default value is["Longitude", "Long", "y"]. -
zAxis: An array of objects used to detect Z-axis coordinates from a column header. The default value is["Altitude", "Alt", "z"]. -
featureLabel: An array of objects used to detect feature labels from a column header. The default value is["Name", "Label", "Title"]. -
Address: An array of objects used to detect street addresses from a column header. The default value is["Street", "Address"]. -
Neighborhood: An array of objects used to detect neighborhoods from a column header. The default value is["Neighborhood"]. -
City: An array of objects used to detect cities from a column header. The default value is["City"]. -
Subregion: An array of objects used to detect subregions from a column header. The default value is["Subregion"]. -
Region: An array of objects used to detect regions from a column header. The default value is["Region", "State", "Province]. -
Postal: An array of objects used to detect postal codes from a column header. The default value is["Postal", "Zip"]. -
PostalExt: An array of objects used to detect postal extensions from a column header. The default value is["postalext", "postal_ext"]. -
CountryCode: An array of objects used to detect country codes from a column header. The default value is["countrycode", "country_code", "cc"]. -
SearchExtent: An array of objects used to detect search extents from a column header. The default value is["searchextent", "search_extent"].
-
-
sourceSpatialReferences: Specifies which Esri spatial reference WKIDs (well-known IDs) to display as options during the data upload process. The default preselected value is WGS 1984 (WKID 4326). Each spatial reference requires the following:-
label: The label for the spatial reference in the dialog box. -
spatialReference: An object that requires a Esri spatial reference WKID. For a list of available WKIDs, see the list of ArcGIS Geographic Coordinate Systems.-
wkid: The well-known ID number. For example,4326.
-
-
preselected: A boolean that sets one Esri spatial reference WKID as the preselected option in the dialog box. The default preselected value is WGS 1984 (WKID 4326).
-
-
LayerDetailsDialogViewModel: Noconfigurationproperties -
TableRecordResultsDialogViewModel: Noconfigurationproperties -
SymbolDialogViewModel: Noconfigurationproperties
Widgets
-
AttributeSymbologySettings: Configures the default behavior for Attribute Symbology. This type of symbology allows users to style features in a layer based on the information in a specific field. For example, if a layer included a field with elevation data, the symbology could be rendered with up to twelve different colors, each color representing an elevation range.-
maxRenderClasses: Sets the maximum number of classes that can be distinguished for the configured attribute. For example, you may wish to configure three classes for three different tree species that your layer identifies. The default value is12. Note that increasing the default to a value greater than 12 can impact performance. -
maxSamples: Defines how many features should be sampled to determine the values of a layer's render classes. The default value is1000. -
defaultPointColor: An array that defines the default color for point features in RGBA format. The default value is[150, 150, 150, 0.8]. -
defaultPointSize: The default size of a point feature in pixels. The default value is12. -
defaultLineColor: An array that defines the default color for line features in RGBA format. The default value is[75, 75, 75, 1]. -
defaultLineWidth: The default width of a line feature in pixels. The default value is2. -
defaultFillColor: The default fill color for features in RGBA format. The default value is[150, 150, 150, 0.3]. -
defaultSymbologySettingsConfig:-
selectOutlineColor: Allows the user to select an outline color. The default value istrue. -
alwaysUseColorSwatches: Allows the user to always choose colors using color pickers. The default value isfalse. -
numberOfColorSwatches: Defines how many color pickers should be available from the attribute symbology settings. The default value is6. -
transparency: Sets the user configuration options for the transparency slider. These properties accept values between 0 and 100 percent, where0is opaque and100is transparent.-
min: Sets the minimum transparency value available, in percent. The default value is0. -
max: Sets the maximum transparency value available, in percent. The default value is90. -
value: Sets the initial transparency value, in percent. The default value is10. -
step: Sets the increment to use when the user increases or decreases the transparency value, in percent. For example, if the value is 10, there are 10 unique transparency values that can be picked between 0 and 100. The default value is5.
-
-
lineWidth: Sets the user configuration options for the symbol line width slider.-
min: Sets the minimum configurable width of the line, in pixels. The default value is0. -
max: Sets the maximum configurable width of the line, in pixels. The default value is5. -
value: Sets the initial configured line width value, in pixels. The default value is2. -
step: Sets the increment to use when the user increases or decreases the line width, in pixels. The default value is1.
-
-
markerSize: Sets the user configuration options for the marker size slider.-
min: Sets the minimum configurable marker size, in pixels. The default value is1. -
max: Sets the maximum configurable marker size, in pixels. The default value is50. -
value: Sets the initial configured marker size value, in pixels. The default value is16. -
step: Sets the increment to use when the user increases or decreases the marker size, in pixels. The default value is1.
-
-
markerStyles: An array of objects that define available marker styles. By default, the styles included arecircle,diamond,cross,x, andsquare. You can configure additional styles that exist in the ArcGIS API for JavaScript.-
style: A string that references an available marker style. -
label: The label to display for the marker style in the viewer. You can use text or a text key. For more information on using text keys, see Configure User Interface Text. The default values for marker style text keys are@language-symbology-settings-marker-style-*, where*is the marker style —circle,diamond, and so on.
-
-
lineStyles: An array of objects that define available line styles. By default, the styles included aresolid,dash,dot, anddashdot. You can configure additional styles that exist in the ArcGIS API for JavaScript.-
style: A string that references an available line style. -
label: The label to display for the line style in the viewer. The line style is the style of the border of the feature marker. You can use text or a text key. For more information on using text keys, see Configure User Interface Text. The default values for line style text keys are@language-symbology-settings-line-style-*, where*is the marker style —solid,dash, and so on.
-
-
fillStyles: An array of objects that define available fill styles. The fill is the most dominant pattern of the feature marker. By default, the styles included aresolid,forwarddiagonal,backwarddiagonal,cross,horizontal, andvertical. You can configure additional styles that exist in the ArcGIS API for JavaScript.-
style: A string that references an available fill style. -
label: The label to display for the fill style in the viewer. You can use text or a text key. For more information on using text keys, see Configure User Interface Text. The default values for fill style text keys are@language-symbology-settings-fill-style-*, where*is the marker style —solid,forward-diagonal,backward-diagonal, and so on.
-
-
-
-
SymbologySettings: Configures the default behavior for Simple Symbology. -
alwaysUseColorSwatches: Defines whether color pickers should always be available. The default value isfalse. -
numberOfColorSwatches: Defines how many color pickers should be available from the attribute symbology settings. The default value is6. -
transparency: Sets the user configuration options for the transparency slider. These properties accept values between 0 and 100 percent, where0is opaque and100is transparent.-
min: Sets the minimum transparency value available, in percent. The default value is0. -
max: Sets the maximum transparency value available, in percent. The default value is90. -
value: Sets the initial transparency value, in percent. The default value is10. -
step: Sets the increment to use when the user increases or decreases the transparency value, in percent. For example, if the value is 10, there are 10 unique transparency values that can be picked between 0 and 100. The default value is5.
-
-
lineWidth: Sets the user configuration options for the symbol line width slider.-
min: Sets the minimum configurable width of the line, in pixels. The default value is0. -
max: Sets the maximum configurable width of the line, in pixels. The default value is5. -
value: Sets the initial configured line width value, in pixels. The default value is2. -
step: Sets the increment to use when the user increases or decreases the line width, in pixels. The default value is1.
-
-
markerSize: Sets the user configuration options for the marker size slider.-
min: Sets the minimum configurable marker size, in pixels. The default value is1. -
max: Sets the maximum configurable marker size, in pixels. The default value is50. -
value: Sets the initial configured marker size value, in pixels. The default value is16. -
step: Sets the increment to use when the user increases or decreases the marker size, in pixels. The default value is1.
-
-
markerStyles: An array of objects that define available marker styles. By default, the styles included arecircle,diamond,cross,x, andsquare. You can configure additional styles that exist in the ArcGIS API for JavaScript.-
style: A string that references an available marker style. -
label: The label to display for the marker style in the viewer. You can use text or a text key. For more information on using text keys, see Configure User Interface Text. The default values for marker style text keys are@language-symbology-settings-marker-style-*, where*is the marker style —circle,diamond, and so on.
-
-
lineStyles: An array of objects that define available line styles. By default, the styles included aresolid,dash,dot, anddashdot. You can configure additional styles that exist in the ArcGIS API for JavaScript.-
style: A string that references an available line style. -
label: The label to display for the line style in the viewer. The line style is the style of the border of the feature marker. You can use text or a text key. For more information on using text keys, see Configure User Interface Text. The default values for line style text keys are@language-symbology-settings-line-style-*, where*is the marker style —solid,dash, and so on.
-
-
fillStyles: An array of objects that define available fill styles. The fill is the most dominant pattern of the feature marker. By default, the styles included aresolid,forwarddiagonal,backwarddiagonal,cross,horizontal, andvertical. You can configure additional styles that exist in the ArcGIS API for JavaScript.-
style: A string that references an available fill style. -
label: The label to display for the fill style in the viewer. You can use text or a text key. For more information on using text keys, see Configure User Interface Text. The default values for fill style text keys are@language-symbology-settings-fill-style-*, where*is the marker style —solid,forward-diagonal,backward-diagonal, and so on.
-