HeatMaps Module
Heat mapping is a data visualization that represents the density of features on the map. The HeatMaps Module works with a number of other modules to implement heat maps. For information about configuring heat maps for a layer, see Heat Maps.
Specifically, the HeatMaps Module implements the visualizationProvider for heat maps and the commands and events that work with heat maps. The HeatMaps Module uses the data from the feature layer to calculate the heat map and renders the heat map on the feature layer.
The HeatMaps Module provides two commands and two events, which you can use in hyperlinks and workflows. The AddHeatMap command renders a heat map for the specified feature layer. HeatMapAddedEvent is raised when a heat map is rendered on the map. The RemoveHeatMap command removes the heat map from the specified feature layer. HeatMapRemovedEvent is raised when a heat map is removed. At most one visualization can be active at a time. For more information, see Viewer Commands and Events.
The HeatMaps Module works with the Menu Module and Visualization Module. The Menu Module has a LayerActions menu item, Turn on/off layer visualizations, that opens the Visualization Options panel, where the user can change visualizations and their settings. The Visualization Options panel is implemented by the Visualization Module.
The HeatMaps Module has one view, HeatMapsView. HeatMapsView presents the heat map settings that end users can configure. By default, HeatMapView is hosted in the LayerVisualizationRegion container region, which is referenced by the Visualization Module's VisualizationViewModel.

The HeatMaps Module's intensity and gradientOptions properties set the defaults to use when a layer's heat map settings are not configured in the site. Every feature layer has a Feature Heat Maps tab in Manager where you can configure the heat map settings for that layer. If a user views the heat maps for two layers at the same time, having different gradients for the different layers makes it possible to distinguish one layer's hot areas from the other layer's hot areas. For more information, see Heat Maps.
Configuration Properties
Module
-
intensity: The default area for the hot areas in a heat map to cover, in pixels. The greater the intensity, the larger the area of coverage. Specify a number from 1 to 100. The default is 30 pixels.The value that you configure here is used for layers whose Feature Heat Maps settings are not configured. For information on configuring the settings for a particular layer, see Heat Maps.
Use a lower intensity for feature layers with a high concentration of data and higher intensity for feature layers with sparse data.
-
gradientOptions: The default colors that represent the hot areas on the map, and the opacity of each color. The viewer creates gradients using the colors that you configure.The values that you configure here are used for layers whose Feature Heat Maps settings are not configured. For information on configuring the settings for a particular layer, see Configure Layers.
-
outermostColor: The outermost color in the gradient is completely transparent by default, to ensure that the outer color changes gradually. We recommend using the default value foroutermostColor. -
outerColor,innerColor,innermostColor: For each color that you want to use to represent hot areas on the map, specify the color's ARGB hex string. For example,#FF9D9D9Dis a completely opaque (FF) shade of gray (9D9D9D).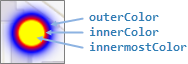
Default gradient—transparent, blue, red, yellow
-
Views
-
HeatMapsView: Noconfigurationproperties
View Models
-
HeatMapsViewModel: Noconfigurationproperties